Both product development and project planning often require making educated guesses. There are two models that I’ve seen for doing this. The first is to have a designated subject matter expert (SME) who provides The Answer. The second is to get a group of SMEs together to discuss and arrive at a consensus answer.
Under most circumstances, I’m not a fan of the first approach. Individuals are simply too fallible, too easily swayed by anecdotes rather than real data or too busy to consider a problem fully and in depth. The exception is when you are estimating work; then the SME is the person who will actually have to do the work, and their estimate is better than anyone else’s. The second solution often suffers from several other problems. Too many people working a problem can take a long time, answers can be driven by the most vocal or the most risk-averse members of the group and groups sometimes deliver bad answers due to diffusion of responsibility or other “group think” effects.
One solution to the problems of group decisions is to use Affinity Diagramming and the Analytical Hierarchy Process (AHP) to structure the problem, gather individual judgements of the alternatives, and then determine their relative values or importance. Affinity diagramming followed by AHP is incredibly powerful, and does a great job taking the individual bias out of the equation. I’ve used it with teams to rank the importance of product requirements, as a training exercise to accurately estimate the relative area of geometric shapes and personally to decide which car to buy. It works.
Unfortunately, AHP takes time, and for any but the simplest assessments, you really need custom software to support the process. Affinity diagramming can be done very effectively with Post-It notes, but the calculations of AHP cannot be easily set up in a program like Excel. It also requires discrete alternatives to choose from. For estimates of a single variable, such as lifetime, or other performance characteristics, I have had to develop a different approach.
The technique below works when you want to create a point estimate of a continuous variable. For instance, you might need to estimate product lifetime and establish a warrant period, or you might need to estimate a performance level that can be communicated to customers (implying a performance guarantee), or you might need to estimate the duration of a set of project activities. We can easily implement the calculations in Excel, R, or a similar tool.
Example
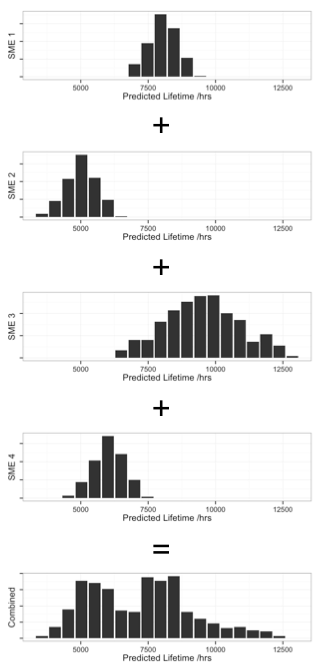
What we’re going to do is get the SMEs to individually estimate a range of possible results (low, most likely, high). Then we’ll generate triangular probability distributions from each estimate and finally combine those estimates. To get a robust result, we will account for the SME’s estimation of their own accuracy, and treat their different estimates discrete distributions when combining.
The below is the data entered by the SMEs.

Using the above data, we can calculate triangular probability distributions for each, then combine them by treating them as discrete distributions. This produces the sequence of distributions, below.
We can then summarize the combined distribution with some useful values:
| most likely: | 7087 | ||
| likely low: | 4360 | ||
| likely high: | 10711 | ||
| 50% between | 5162 | and | 8370 |
The process
- Bring a few SMEs together. While the technique will work with any number, usually five to six is more than sufficient, and ten should be considered the maximum for useful input. We’ll call this number N so we can refer to it later.
- Define the problem. Everyone should agree precisely what you are estimating.
- Agree on a basis for the evaluation. This might be an agreed conceptual model of how the product behaves or a set of criteria or goals to evaluate against.
- Collect three estimates—low, most likely, high—from each SMEs for the variable of interest (call this variable X).
Collecting a range is important; we need to be honest with ourselves that we don’t know what the value will actually be: there is uncertainty in the SME judgement—if we had the data to be more precise then we’d use that—and there’s variation to consider. Ranges allow us to derive probabilistic estimates that represent both the limits of our SME’s knowledge and the natural variation.
- Ask each SME for their assessment of three probabilities on a scale of 0% to 100%:
- How likely are we to see the real data fall within this range if your reasoning or model is correct? This will usually be very high, like 95% or higher.
- How likely are we to see the real data fall within this range even if your reasoning has some flaw? This may also be high, but you can use 50% if the answer is “I don’t know.”
- How likely is it that the reasoning is correct? Again, this will usually be pretty high. That’s why they’re SMEs.
At this point, you have all the information that you need from the SMEs and can proceed to the calculations.
- Using the three probabilities of the argument accuracy, calculate the values of X at end points for a triangular probability distribution.
- For each SME’s guesstimates, use the triangle distributions to generate a large number of probabilities across the total range of possible Xs.
- For each value of X used in the generation of the probability distributions, randomly choose a probability from one of the SMEs. For each value of X, we now have N probabilities that we treat as part of a discrete distribution.
- Use the resulting combined distribution to determine values of interest, e.g. the median, fifth percentile, ninety-fifth percentile and so on.
From a diverse set of estimates, you now have a single, robust estimation for a variable. The resulting probability distribution will not be smooth, but you will be able to pull out single values that are meaningful and robust, such as the ninety-fifth percentile for duration estimates.
A few tips
How you ask for the estimates matters. Just asking for “low,” “middle” and “high” estimates will get you very inconsistent results. Likewise, asking for “worst-case” or “best-case” will often get you some pretty wild estimates. You want to ask questions like “how long would this take if many things went right,” “how long would the product last in more severe operating conditions” or “what is the most likely power available?” You don’t want the “middle” estimate, but a “most likely” estimate; you’re not shooting for half-way between the low and high estimates, but for a high-probability point estimate.
When some SMEs know more about the variable being estimated than others, you could also weight their judgements. This weighting is used in the second to last step by adjusting the probability of randomly selecting a value from each SME’s probability distribution.
