Individuals and moving range charts, abbreviated as ImR or XmR charts, are an important tool for keeping a wide range of business and industrial processes in the zone of economic production, where a process produces the maximum value at the minimum costs.
While there are many commercial applications that will produce such charts, one of my favorites is the free and open-source software package R. The freely available add-on package qcc will do all the heavy-lifting. There is little documentation on how to create a moving range chart, but the code is actually quite simple, as shown below.
The individuals chart requires a simple vector of data. The moving range chart needs a two-column matrix arranged so that qcc() can calculate the moving range from each row.
library(qcc)
#' The data, from sample published by Donald Wheeler
my.xmr.raw <- c(5045,4350,4350,3975,4290,4430,4485,4285,3980,3925,3645,3760,3300,3685,3463,5200)
#' Create the individuals chart and qcc object
my.xmr.x <- qcc(my.xmr.raw, type = "xbar.one", plot = TRUE)
#' Create the moving range chart and qcc object. qcc takes a two-column matrix
#' that is used to calculate the moving range.
my.xmr.raw.r <- matrix(cbind(my.xmr.raw[1:length(my.xmr.raw)-1], my.xmr.raw[2:length(my.xmr.raw)]), ncol=2)
my.xmr.mr <- qcc(my.xmr.raw.r, type="R", plot = TRUE)
This produces the individuals chart:
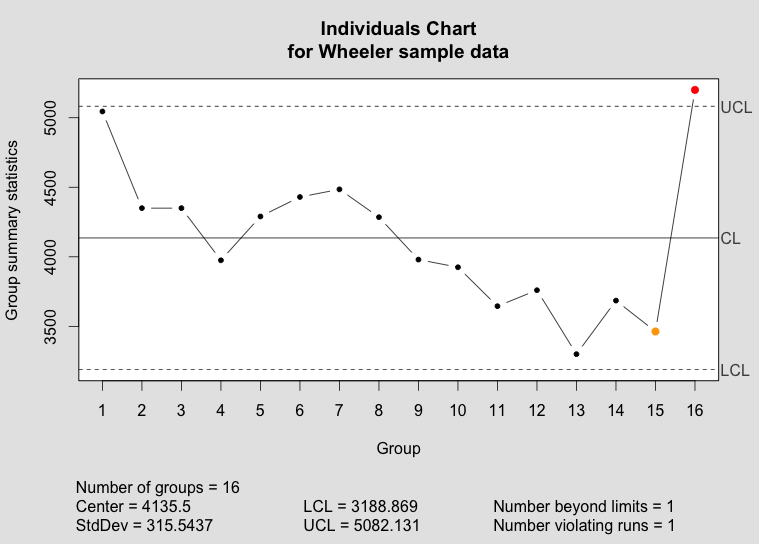
The qcc individuals chart.
and the moving range chart:
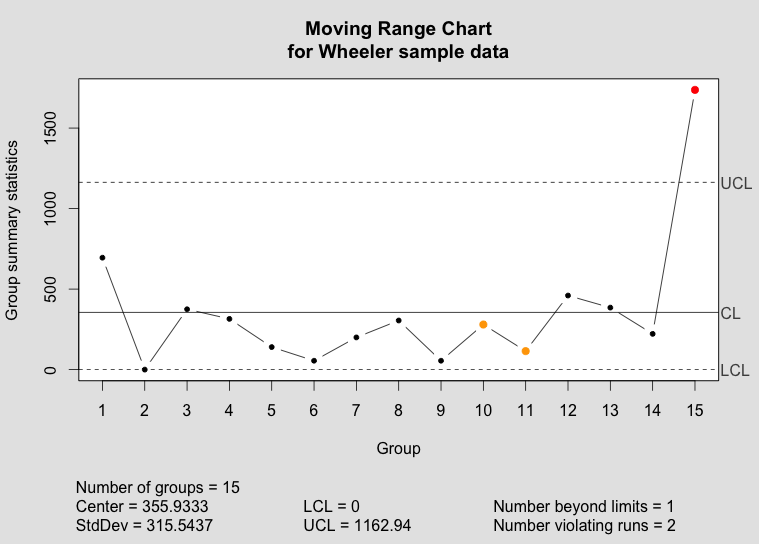
The qcc moving range chart.
The code is also available as a gist.
References
- R Core Team (2013). R: A language and environment for statistical computing. R Foundation for Statistical Computing, Vienna, Austria. URL http://www.R-project.org/.
- Scrucca, L. (2004). qcc: an R package for quality control charting and statistical process control. R News 4/1, 11-17.
- Wheeler, Donald. “Individual Charts Done Right and Wrong.” Quality Digest. 2 Feb 20102 Feb 2010. Print. <http://www.spcpress.com/pdf/DJW206.pdf>.

Hi. Thanks very much for the helpful example. (For one of my own projects) I added a density plot on the left of the SPC chart, and a few other small things.
I put the code on GitHub with a simple example, also using Shiny:
https://github.com/longcr/Shiny-Simple-SPC
The ggplot2 code can be extracted from the Shiny server.R file and used separately if needed.
Sorry. The code with the ggplot2 approach is here:
https://github.com/longcr/Shiny-Simple-SPC-ggplot2-graphics
Hi, Tom;
I’m a NOOB in the R Programming world, so sorry for posing this, if it is too basic of a question.
I have just implemented your updated Individuals plotting ggplot2 code from March 14, 2014, and it has really been great to have!
I was wondering how to implement a plot of Process Limit points, in the Individuals chart, as well as the Control Limits, for each timestamp. This, to show where the current process controls are in relation to the actual data measurement.
Is there a “hook” that you might point me to? I would like to at least have the low and high Process limits be color-selectable, as well.
Great work on the implementation and subsequent ggplot2 code!
Thanks,
Bill Garber
bill_garber@comcast.net
Bill, there is deliberately no direct hook within the plot.qcc() call to add either customer or manufacturing specification limits. However, since the graph object that results from the call to plot.qcc() is itself a grid object, you should be able to overlay any grid object on it. See the following for a basic introduction to grid graphics: https://www.stat.auckland.ac.nz/~paul/useR2015-grid/grid-slides.html
I can say that I will not add such capability because the two analyses are totally independent. “Out of control” (or unpredictable) requires completely different approaches to correct than “out of specification.” Typically, unpredictable behavior is a result of how the process is managed, while out of spec is a result of the design of the process. A control chart, or natural process behavior chart, is designed to analyze process predictability, while a process capability analysis tells you how much of the process output can be expected to be out of spec. I think Wheeler explains this nicely: https://www.spcpress.com/pdf/DJW203.pdf
See also Wheeler’s article on establishing manufacturing specifications for some related commentary: http://asq.org/statistics/2003/05/how-to-establish-manufacturing-specifications.pdf
Thanks for your speedy reply, and for the links & comments! I’ll check them out.
Regards, Bill