Individuals and moving range charts, abbreviated as ImR or XmR charts, are an important tool for keeping a wide range of business and industrial processes in the zone of economic production, where a process produces the maximum value at the minimum costs.
While there are many commercial applications that will produce such charts, one of my favorites is the free and open-source software package R. The freely available add-on package qcc will do all the heavy-lifting. There is little documentation on how to create a moving range chart, but the code is actually quite simple, as shown below.
The individuals chart requires a simple vector of data. The moving range chart needs a two-column matrix arranged so that qcc() can calculate the moving range from each row.
library(qcc)
#' The data, from sample published by Donald Wheeler
my.xmr.raw <- c(5045,4350,4350,3975,4290,4430,4485,4285,3980,3925,3645,3760,3300,3685,3463,5200)
#' Create the individuals chart and qcc object
my.xmr.x <- qcc(my.xmr.raw, type = "xbar.one", plot = TRUE)
#' Create the moving range chart and qcc object. qcc takes a two-column matrix
#' that is used to calculate the moving range.
my.xmr.raw.r <- matrix(cbind(my.xmr.raw[1:length(my.xmr.raw)-1], my.xmr.raw[2:length(my.xmr.raw)]), ncol=2)
my.xmr.mr <- qcc(my.xmr.raw.r, type="R", plot = TRUE)
This produces the individuals chart:
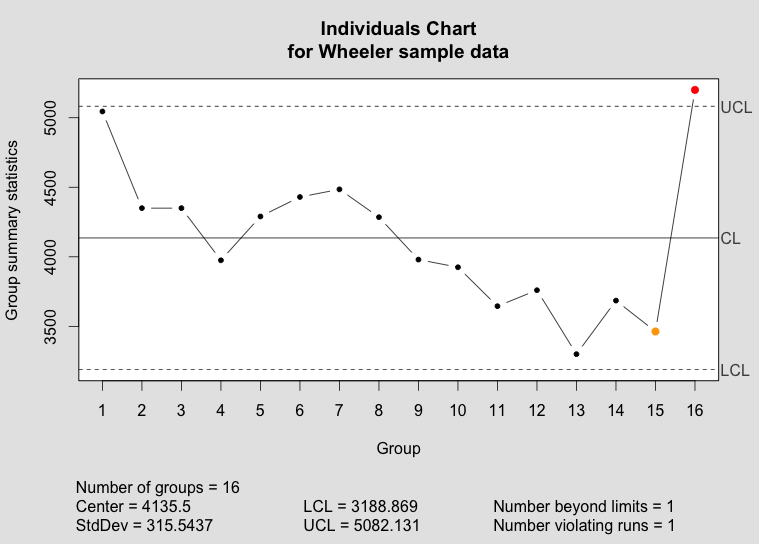
The qcc individuals chart.
and the moving range chart:
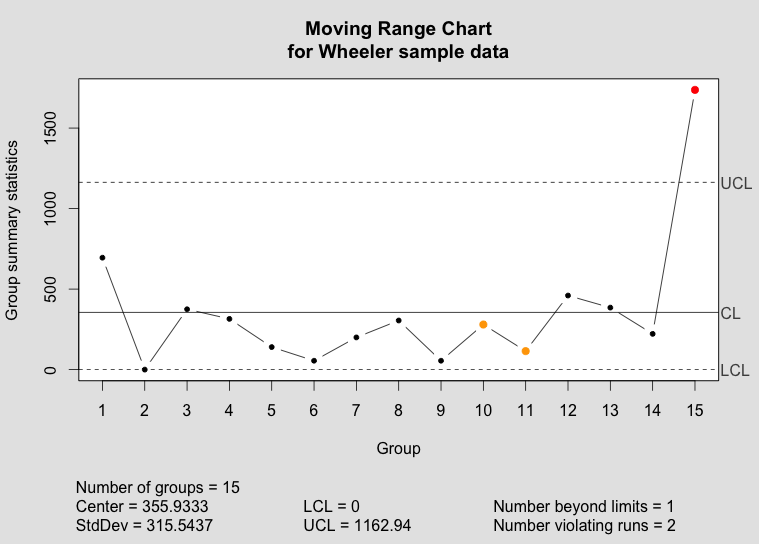
The qcc moving range chart.
The code is also available as a gist.
References
- R Core Team (2013). R: A language and environment for statistical computing. R Foundation for Statistical Computing, Vienna, Austria. URL http://www.R-project.org/.
- Scrucca, L. (2004). qcc: an R package for quality control charting and statistical process control. R News 4/1, 11-17.
- Wheeler, Donald. “Individual Charts Done Right and Wrong.” Quality Digest. 2 Feb 20102 Feb 2010. Print. <http://www.spcpress.com/pdf/DJW206.pdf>.

You must be logged in to post a comment.