Previously, I introduced the idea that samples do not look exactly like the populations that they are drawn from, and had a closer look at what impact sample size has on our ability to estimate population statistics like mean, proportion or Cpk from samples. Here, I will have a closer look at how this uncertainty impacts our engineering process. In the next post, I will tie in the engineering impacts and decisions to the business value and costs.
Difference to detect
When we are testing, we’re either testing to determine that the new product or process performs better than the old or, for cost reduction projects, that the cheaper product or process is at least as good as the existing one.
This means that we need to detect a difference between old and new values, such as a difference in the mean weight between the new and old parts. The larger the sample size, 


Given the uncertainties in our estimate of 


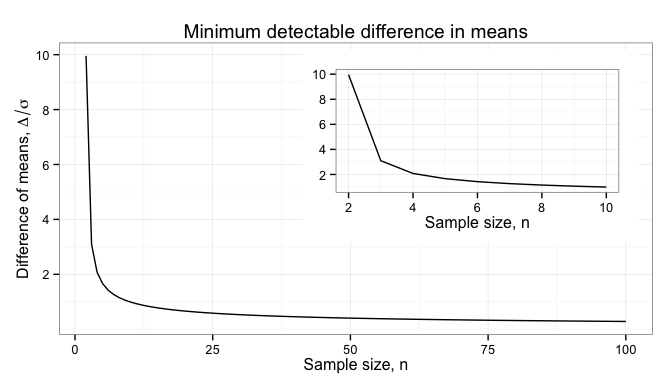
Mean
When trying to determine if a new product or process is better than an old one, we are usually interested in shifting the mean. We want a product to be lighter, provide more power, or a process to work faster. In such cases, we need to estimate the difference of the means, 
Standard deviation
In many Six Sigma projects, and any time we want to shift the mean closer to a specification limit, we need to compare the new population standard deviation with the old. The simplest way of making this comparison is by taking the ratio 

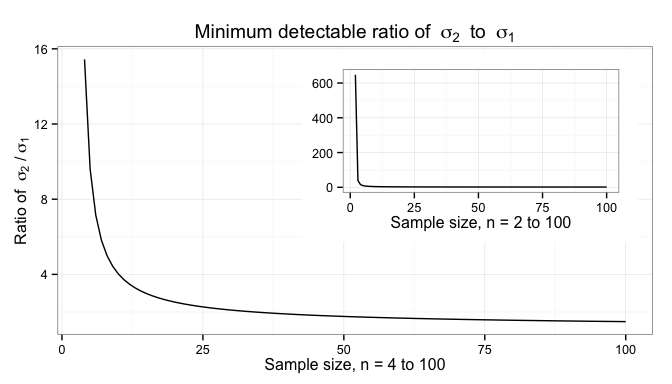
You can see from the inset plot, which includes sample sizes of 2 and 3, that small sample sizes really hurt comparisons of variance, and that interesting differences in variance can’t be detected until we have more than 10 samples.
Proportions
Proportions, such as fraction of defective parts between a new and old design, can be compared by looking at the difference between the two proportions, 
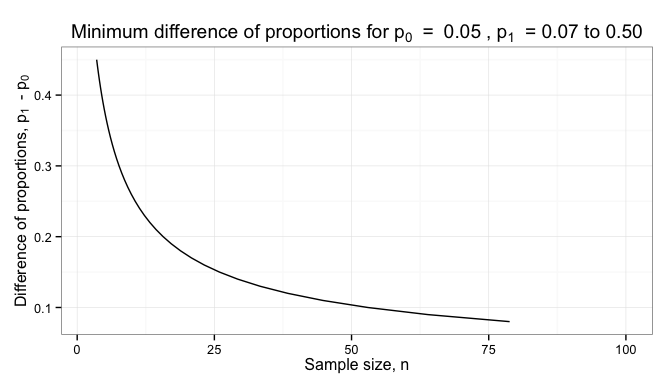
You can see from this that proportions data provides much less information than variable data; we need much larger sample sizes to achieve usefully small
Summary and look forward
When designing experiments, the goal is to detect some difference between two populations. The uncertainty in our measurements and the variation in the parts has a big impact on how many parts we need to test, or greatly limits what we can learn from an experiment.
Next time, I’ll show how these calculations of sample size and uncertainty impact the busines.

One thought on “Sample Size Matters: Design and Experiments”