The Most Useful Data Plot You’ve Never Used

Those of us working in industry with Excel are familiar with scatter plots, line graphs, bar charts, pie charts and maybe a couple of other graph types. Some of us have occasionally used the Analysis Pack to create histograms that don’t update when our data changes (though there is a way to make dynamic histograms in Excel; perhaps I’ll cover this in another blog post).

One of the most important steps in data analysis is to just look at the data. What does the data look like? When we have time-dependent data, we can lay it out as a time-series or, better still, as a control chart (a.k.a. “natural process behavior chart”). Sometimes we just want to see how the data looks as a group. Maybe we want to look at the product weight or the cycle time across production shifts.

Unless you have Minitab, R or another good data analysis tool at your disposal, you have probably never used—maybe never heard of—boxplots. That’s unfortunate, because boxplots should be one of the “go-to” tools in your data analysis tool belt. It’s a real oversight that Excel doesn’t provide a good way to create them.

For the purpose of demonstration, let’s start with creating some randomly generated data:

head(df)
##   variable   value
## 1   group1 -1.5609
## 2   group1 -0.3708
## 3   group1  1.4242
## 4   group1  1.3375
## 5   group1  0.3007
## 6   group1  1.9717
tail(df)
##     variable   value
## 395   group1  1.4591
## 396   group1 -1.5895
## 397   group1 -0.4692
## 398   group1  0.1450
## 399   group1 -0.3332
## 400   group1 -2.3644

If we don’t have much data, we can just plot the points:

library(ggplot2)

ggplot(data = df[1:10,]) +
  geom_point(aes(x = variable, y = value)) +
  coord_flip() +
  theme_bw()

Points plot with few data

But if we have lots of data, it becomes hard to see the distribution due to overplotting:

ggplot(data = df) +
  geom_point(aes(x = variable, y = value)) +
  coord_flip() +
  theme_bw()

Points plot with many data

We can try to fix this by changing some parameters, like adding semi-transparency (alpha blending) and using an open plot symbol, but for the most part this just makes the data points harder to see; the distribution is largely lost:

ggplot(data = df) +
  geom_point(aes(x = variable, y = value), alpha = 0.3, shape = 1) +
  coord_flip() +
  theme_bw()

Points plot with many data using alpha blending

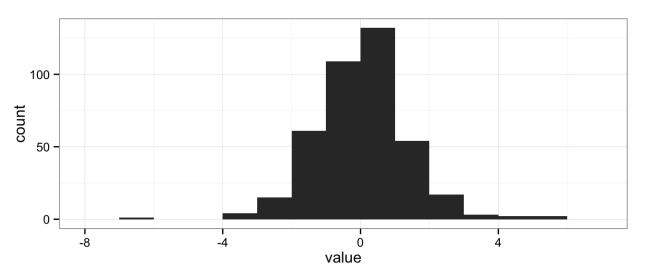
The natural solution is to use histograms, another “go-to” data analysis tool that Excel doesn’t provide in a convenient way:

ggplot(data = df) +
  geom_histogram(aes(x = value), binwidth = 1) +
  theme_bw()

histogram

But histograms don’t scale well when you want to compare multiple groups; the histograms get too short (or too narrow) to really provide useful information. Here I’ve broken the data into eight groups:

head(df)
##   variable   value
## 1   group1 -1.5609
## 2   group1 -0.3708
## 3   group1  1.4242
## 4   group1  1.3375
## 5   group1  0.3007
## 6   group1  1.9717
tail(df)
##     variable   value
## 395   group8 -0.6384
## 396   group8 -3.0245
## 397   group8  1.5866
## 398   group8  1.9747
## 399   group8  0.2377
## 400   group8 -0.3468
ggplot(data = df) +
  geom_histogram(aes(x = value), binwidth = 1) +
  facet_grid(variable ~ .) +
  theme_bw()

Stacked histograms

Either the histograms need to be taller, making the stack too tall to fit on a page, or we need a better solution.

The solution is the box plot:

ggplot() +
  geom_boxplot(data = df, aes(y = value, x = variable)) +
  coord_flip() +
  theme_bw()

Stacked boxplots

The boxplot provides a nice, compact representation of the distribution of a set of data, and makes it easy to compare across a large number of groups.

There’s a lot of information packed into that graph, so let’s unpack it:

Boxplot with markup

Median
A measure of the central tendency of the data that is a little more robust than the mean (or arithmetic average). Half (50%) of the data falls below this mark. The other half falls above it.
First quartile (25th percentile) hinge
Twenty-five percent (25%) of the data falls below this mark.
Third quartile (75th percentile) hinge
Seventy-five percent (75%) of the data falls below this mark.
Inter-Quartile Range (IQR)
The middle half (50%) of the data falls within this band, drawn between the 25th percentile and 75th percentile hinges.
Lower whisker
The lower whisker connects the first quartile hinge to the lowest data point within 1.5 * IQR of the hinge.
Upper whisker
The upper whisker connects the third quartile hinge to the highest data point within 1.5 * IQR of the hinge.
Outliers
Any data points below 1.5 * IQR of the first quartile hinge, or above 1.5 * IQR of the third quartile hinge, are marked individually as outliers.

We can add additional values to these plots. For instance, it’s sometimes useful to add the mean (average) when the distributions are heavily skewed:

ggplot(data = df, aes(y = value, x = variable)) +
  geom_boxplot() +
  stat_summary(fun.y = mean, geom="point", shape = 10, size = 3, colour = "blue") +
  coord_flip() +
  theme_bw()

Stacked box plots with means

Graphs created in the R programming language using the ggplot2 and gridExtra packages.

References

  1. R Core Team (2014). R: A language and environment for statistical computing. R Foundation for Statistical
    Computing, Vienna, Austria. URL http://www.R-project.org/.
  2. H. Wickham. ggplot2: elegant graphics for data analysis. Springer New York, 2009.
  3. Baptiste Auguie (2012). gridExtra: functions in Grid graphics. R package version 0.9.1.
    http://CRAN.R-project.org/package=gridExtra

Waste in TPS vs. Lean PD

The Toyota Production System (TPS), or Lean, is widely considered a remarkable and effective system for improving operations. People naturally try to apply the same system to other product streams and other activities. However, I have found that people often struggle with the correct application of the concepts, especially to product development. For instance, Glen Reynolds, an experienced project manager, is working to understand Agile, and has recently come across the statement by some Agile advocates that “testing is a waste.” Calling testing a waste, as a general statement, is nonsense, and Glen is engaged in some excellent discussion on the subject.

I have encountered a fair number of people with experience in product development, and a fair number with experience in Lean manufacturing, but few people with sufficient overlap in the two domains to combine them. The TPS is very formulaic, laying out clear rules or guidelines that are easily followed. Unfortunately, product development is sufficiently different from manufacturing that the TPS cannot be applied directly.

The TPS defines waste as any activity (or inactivity) that does not add value to the product. Value is defined from the customer’s perspective as any activity that the customer is willing to pay for as a part of the product. Assembling the product adds value; holding the product in inventory does not. Shipping product in exchange for payment adds value; the time spent processing that payment through Accounting does not.

Testing is used in manufacturing to detect defects. The customer is willing to pay for a correctly-manufactured product; not for the rejects. From this perspective, testing is a waste, because it does nothing to add value to the product. In fact, all of product development should be considered waste, because product development does not produce any product (unless, of course, your product happens to be product designs for others to manufacture, as with Ideo).

However, in product development, testing can add value. In fact, testing is probably the only way to maximize value creation in product development.

Manufacturing is a highly repetitive activity, which takes as its input a product and process design and tooling, and produces as its output a physical product. The physical product generates revenue. Ideally, the product is manufactured exactly to specification, and there are no activities required that do not lead directly to the manufacture of the product. There is no uncertainty as to what the output should be. Waste, then, is any deviation from this ideal state. Economically, the assumption is that the product is designed to maximize revenue generation, and the process is designed to correctly manufacture the product. Since nothing is perfect, the TPS seeks to improve profit by eliminating or minimizing those activities that do not generate revenue.

In contrast, product development is a highly variable activity, with variable inputs. The goal of product development is not simply to produce product designs according to some predefined specification. If it was, then product development would be a simple exercise in transforming specifications into conforming drawings. In fact, product development operates under a high degree of uncertainty; from the start of the project, the desired outcome is not fully known. In order to overcome this uncertainty, product developers have to learn. They have to learn about the customer—the end user—and about the technology that they are working with. Value is created as the uncertainties are resolved. The goal of product development is to maximize the rate of learning, thereby maximizing the rate of value creation.

The best way to learn is through trial and error, following the scientific method of hypothesis testing. So testing not a waste if it generates new knowledge. Testing that does not generate new knowledge is a waste. If you generate data that you already had, you’re generating waste. If you generate data that you don’t use, you’re generating waste. If the organization learns something, then you’ve created value.

Notice that this definition of product development follows the same principle that is used in the TPS: do what creates (or produces) value; eliminate or minimize everything else. The details change in the presence of uncertainty about the desired outcome.

We can take this a step further, to develop a more sophisticated approach to managing product development projects, if we understand the economics of our project. The uncertainty that is reduced through testing is all technical risk that the product will not meet the market’s requirements. This means that testing translates into increased sales volumes. Testing in product development adds time, which means a later entry into the market and possibly reduced sales volumes. If we have some estimate of what the cost of delay and the cost of risk are, we can then perform a cost-benefit analysis on the proposed testing to determine whether or not it results in a net creation of value.

Such economic models do not have to be complex, and they do not have to be highly accurate. They need to be just accurate enough that they do not lead to very bad decisions and they must be usable. This suggests, as Reinertsen has advocated, that new product development projects should develop economic models as early as possible and derive decision rules that project managers and lead engineers can use on a daily basis.